Yield Curve of Bond
Harvey Feriors
Editor
Published
Harvey Feriors
Editor
Published
The yield curve is a line that plots bond yields in different maturity dates. The graph’s horizontal (X-axis) is a line of months or years remaining to maturity. The vertical (Y-axis) represents the bond yield. There are three main yield curve types: Normal yield curve (upward sloping), Inverted yield curve (downward sloping), and Flat yield curve.
The slope of the yield curve indicates interest rate, economic activity, and investors’ concern about risk. This is because shifts in the yield curve shape and slope are related to investor expectations on the economic growth and interest rates.
Normally, the yield curve is a comparison of 1-month, 2-month, 3-month, 6-month, 1-year, 2-year, 3-year, 5-year, 7-year, 10-year, 20-year, and 30-year U.S. Treasury. The U.S. Department of Treasury provides daily Treasury Yield Curve rates, which can be used to plot the yield curve for that day.
Key Points
The normal yield curve is an upward sloping yield curve in which longer maturity bonds yield is higher than shorter-term bonds yield. A normal yield curve is when investors are confident in future economic growth. This is the common shape of the yield curve in a normal economic situation.
In the normal yield curve period, a 30-year Treasury yield is higher than a 10-year Treasury yield. This is the same situation as when some lend your money for a longer period (higher risk), you will need more interest rate than normal as a return.
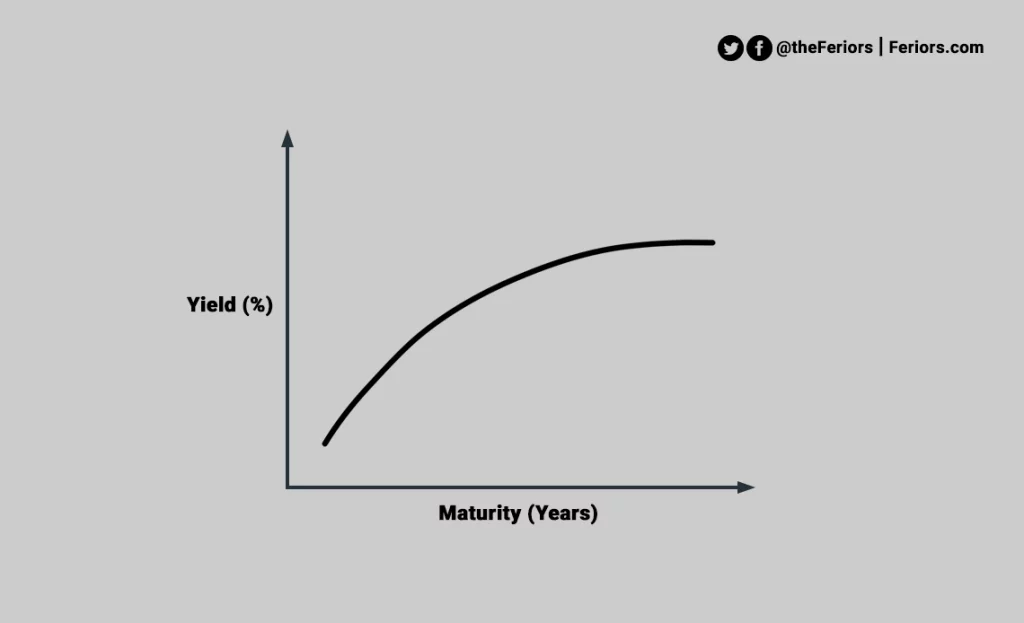
Long-term securities are exposed to greater risk, the longer period increases the probability of unexpected events. This is the reason why long-term maturity bonds are typically offering higher interest rates and have higher volatility. In contrast, short-term securities are exposed to lower yields since they carry lower risk.
However, this does not mean investors will put their funds in the longest-term bonds to take the highest yield. This is because during a normal yield curve period 5-year bond yield and 30-year bond yield isn’t much different. Investors tend to put their funds in 5-year Treasury instead since its a shorter maturity.
The inverted yield curve is a downward sloping yield curve in which longer maturity bonds yield is lower than shorter-term bonds yield. This means the investors are concerned about future economic growth and the bearish stock market.
Concerned investors will allocate their money into longer-term government bonds as a safe haven because investing in low-yield government bonds (which is low yield) is still better than losing money to the stock market crash.
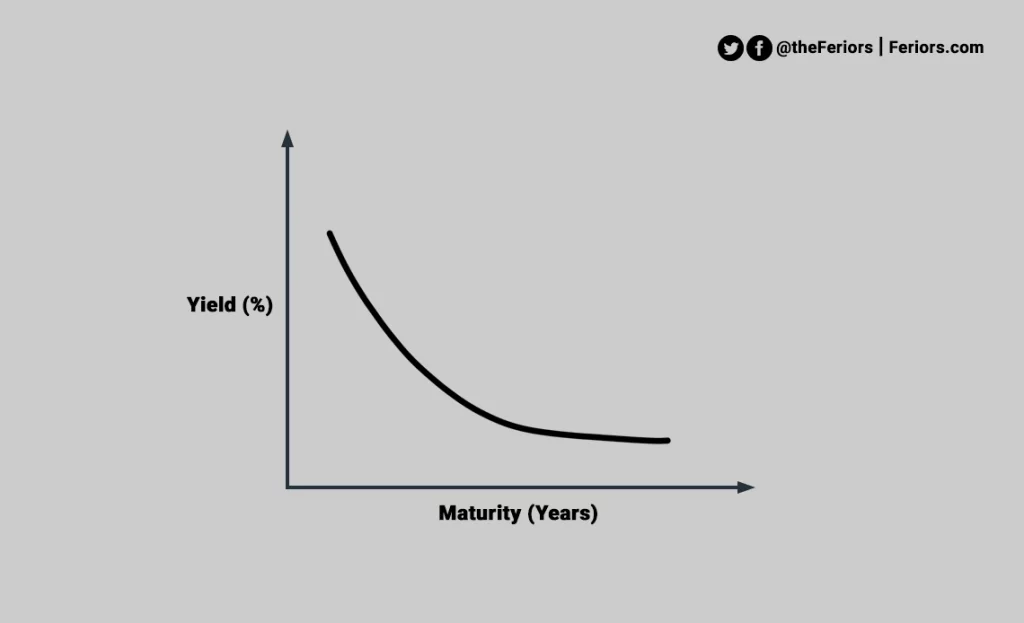
When the demand for long-term Treasury is raised, the long-term bond yield is lower (than shorter-term Treasury). This is a reason why the normal yield curve turned into the inverted yield curve.
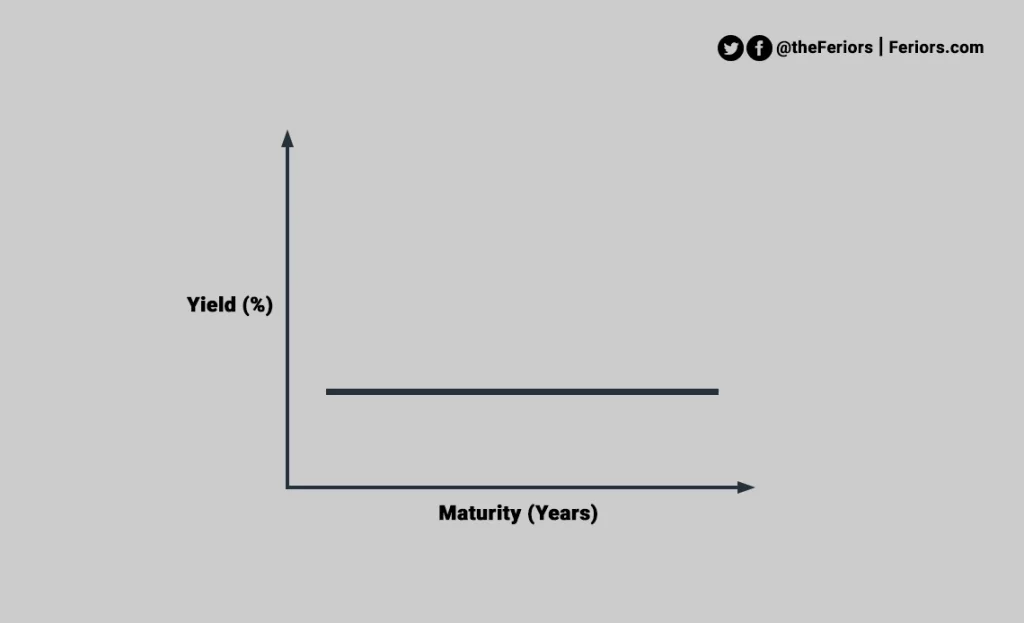
The flat yield curve appears when all maturities bonds have similar yields. This happens during the transitional period between the normal yield curve and the inverted yield curve. The flattening yield curve may be a result of long-term Treasury yield falling more than short-term Treasury yield, or short-term yield increasing more than long-term yield.