What is BCG Matrix?
The BCG matrix is a portfolio management framework that determines how each product and business unit within a group is performing. The BCG matrix assists companies to prioritize their product or business unit to allocate investment among their portfolio in the future and indicates where investment should be focused (hold it, divest, or invest more).
The Boston Consulting Group (BCG) growth share matrix was developed in 1968 and published as “The Product Portfolio” in 1970 by Boston Consulting Group’s founder, Bruce Henderson. The BCG matrix is also known as Growth-share matrix, the Boston Consulting Group matrix, BCG Growth-share matrix, Boston Consulting matrix, and Boston model.
The BCG growth-share matrix helps companies analyze their portfolio by dividing the matrix into quadrants with relative market share along the X-axis and rate of market growth along the Y-axis.
- Relative market share represents company competitiveness — not market share in itself, but it’s your market share relative to the largest competitor in the industry. However, market share itself is not indicate of relative strength, 25% market share may be a small in a fragmented industry, but maybe a strength in concentrated industry.
- Market growth represents market attractiveness — the rate of market growth, can be forecast annual average growth rate over the period (such as 3 or 5 years). High growth rates then signal which markets have the most growth potential.
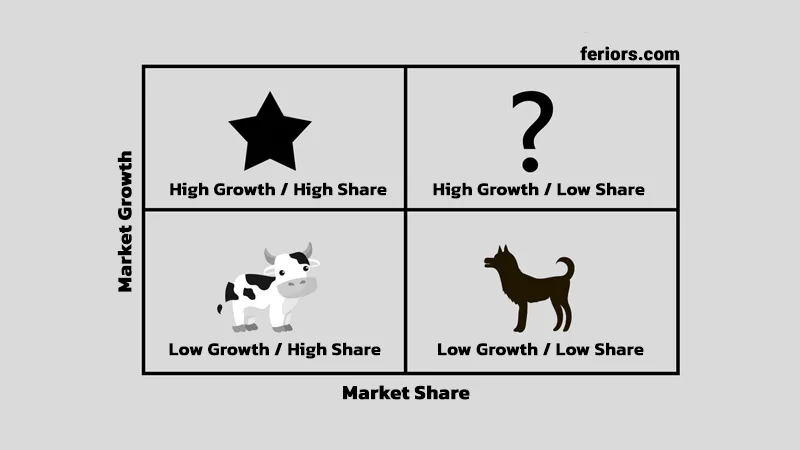
Each of the four quadrants in the BCG matrix represents a combination of relative market share, and market growth:
- Stars: High Growth, High Share. Companies should invest in these “stars” as they have high future potential.
- Cash cows: Low Growth, High Share. Companies should harvest from these “cash cows” for cash to reinvest.
- Question marks: High Growth, Low Share. Companies should invest in or discard these “question marks,” depending on their chances of becoming stars.
- Dogs: Low Share, Low Growth. Companies should liquidate, divest, or reposition these “dogs.”
Put it simply, the company should invest in stars, harvest from cash cows, divest from dogs, and analyze risks and returns of question marks products depending on their chances of becoming stars.
At the height of its success, the growth share matrix was used by about half of all Fortune 500 companies; today, it is still central in business school teachings on business strategy.
What Is the Growth Share Matrix? by Boston Consulting Group
Keep in mind, the BCG matrix is not about the whole company analysis. But it’s about a single product or business unit of the company portfolio. There may be both Stars and Dogs in the same portfolio.
Stars
Stars are in the upper-right quadrant of the BCG matrix, products within this quadrant have a high market share compared to competitors in a high-growing market. A star product is mostly price leader and can be highly profitable according to market growth, and sometimes can enjoy a monopoly.
Stars are the most important type of product in the BCG matrix because ‘stars’ are the future of your company. However, the product in a high level of growth will demand an investment heavily in cash to maintain the market share against other competitors, so this kind of product should not dominate a company portfolio.
Cash Cows
Cash cows are placed in the bottom-right quadrant of the BCG matrix. Cash cows represent products that are in high relative market share in a slow-growing market. These are successful products with low growth opportunities. The company need no or little investment on cash cows products, they are often highly profitable without doing much
These products play a supporting role by generating cash for the company because of their strong competitive position. A good number of cash cows in the portfolio are recommended because the company can milk these cash cows to invest in other products in the company’s portfolio (invest in stars and question marks).
Question Marks
Question marks are in the top-left quadrant of the BCG growth-share matrix. The question mark represents products or services with low market share but operating in a high-growing market. These products may have potential, but still require more investment to increase their market share.
A good number of question marks products are useful because products in this quadrant may be able to increase their market share and become a star. So, the company needs to decide which to abandon and which to support.
Dogs
Dogs are placed in the bottom-left quadrant of the BCG matrix. The dogs of the BCG matrix represent products or services with low market share and low-growing market.
Dogs are not generating much profit for the company since they have a low relative market share and low growth. Dogs are the exact opposite to stars some are aged product, the company needs to decide to refresh that product or divest that dog.
References:
- What Is the Growth Share Matrix? published by BCG
- BCG Classics Revisited: The Growth Share Matrix published by Boston Consulting Group